
Prescreen Analytics: New Study-Specific Prescreen Response Summary
Published February 14, 2025
What’s New in this Prescreen View?
- Quickly & easily analyze responses across study participants
- Track changes to sample characteristics during study
- View chart & table breakdown of study participant responses
Accessing Prescreen Response Summary
As much as we’d love to jump into a description of this great new feature, it’s probably best to let you know where to find it. Even more important is if you can find it. To these ends, first we’ll cover the prerequisites for using Prescreen Response Summary, and next where to find it if you have the necessary features/settings enabled.
Requirements:
1) Your site must have a prescreen
2) Your site must have Prescreen Viewing enabled
The first condition is pretty obvious. The second may be less familiar, particularly if you aren’t an administrator. The setting is shown below:
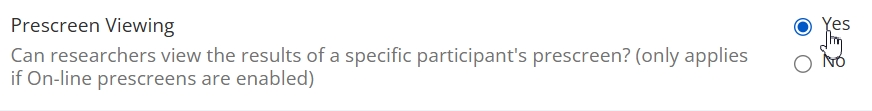
The “On-line prescreens” requirement is another way of saying condition 1) above (namely, that your site has a prescreen).
Those are the prerequisites. If they’re satisfied, then we can show you where to go.
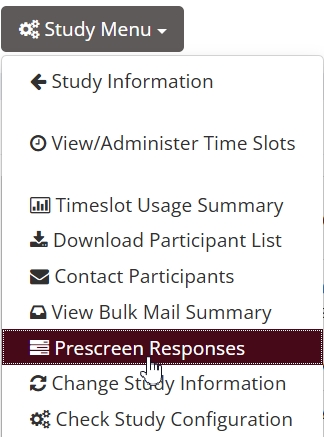
Previously, the Study Menu dropdown had an option to “Download Prescreen Responses.” That option is no longer available. Instead, you’ll see a menu option for “Prescreen Responses”, shown below:
This will bring you to a brand new landing page with two different prescreen options:
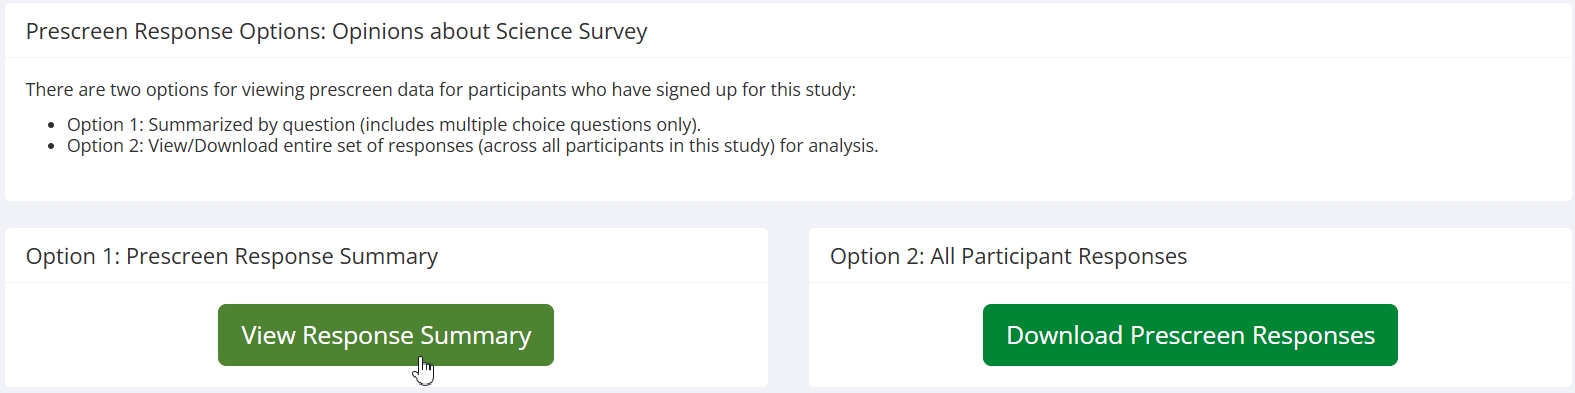
The option on the left, Prescreen Response Summary, brings you to a new page and a whole new way to approach participant prescreen responses.
Navigating Prescreen Response Summary
Much of the reason behind creating Prescreen Response Summary is simplicity. If it needed a lot of explanation, then we’d have gone back to the drawing board. The feature is meant to be an easy-to-use tool that clearly shows researchers the response breakdowns across all participants in their study (this includes all participants who have signed up for a study—whether or not they have participated yet—except for participants marked as no-shows).
Instead of lengthy instructions, we’ll showcase this new visualization tool the way it deserves to be: visually.
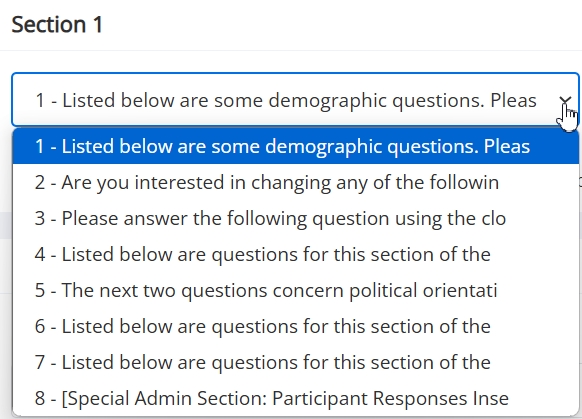
First, note that there are two dropdown menus. The first lets you select the prescreen section you want to view:
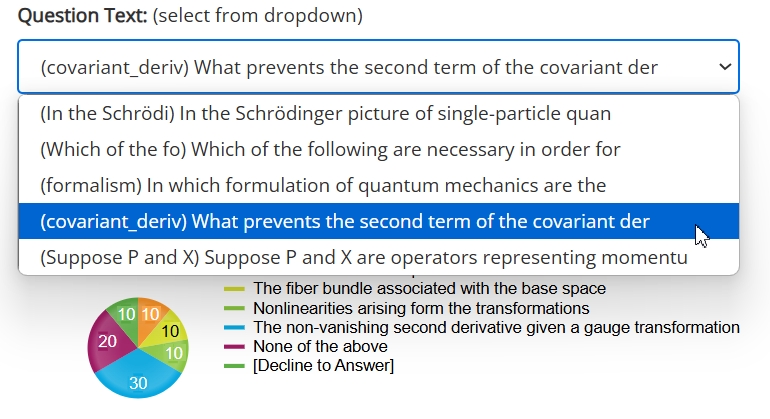
The second dropdown menu is (you guessed it!) for selecting which question to view in the chosen section:
This is a good place to point out that not all question types are will be shown. Free text questions are not included. The reason is simple: These won’t yield a useful display of response breakdowns, and would defeat the purpose.
All multiple choice questions are included, though, both the “select one” type and the “select many” (or “select-all-that-apply”) type.
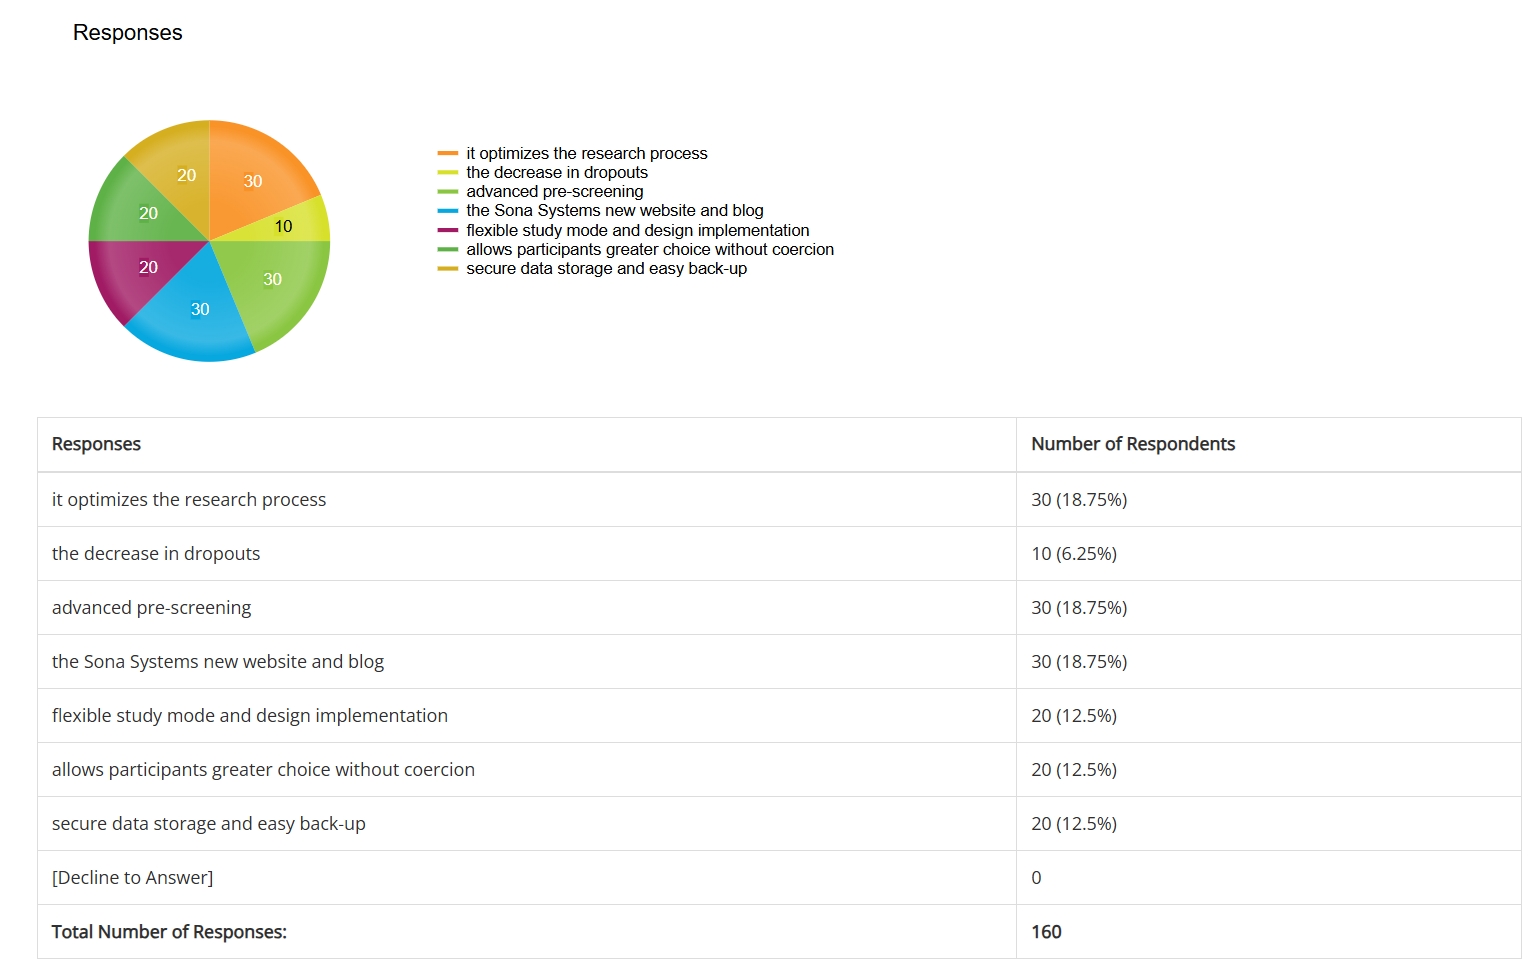
Each time you select a section and a question, a new pie chart and table will display the participant response breakdown for that study at that time. If you want to keep an eye on the response distributions for a particular question during a study, that’s no problem. You can observe how the response percentages change overtime, starting from after the first few sign-ups:
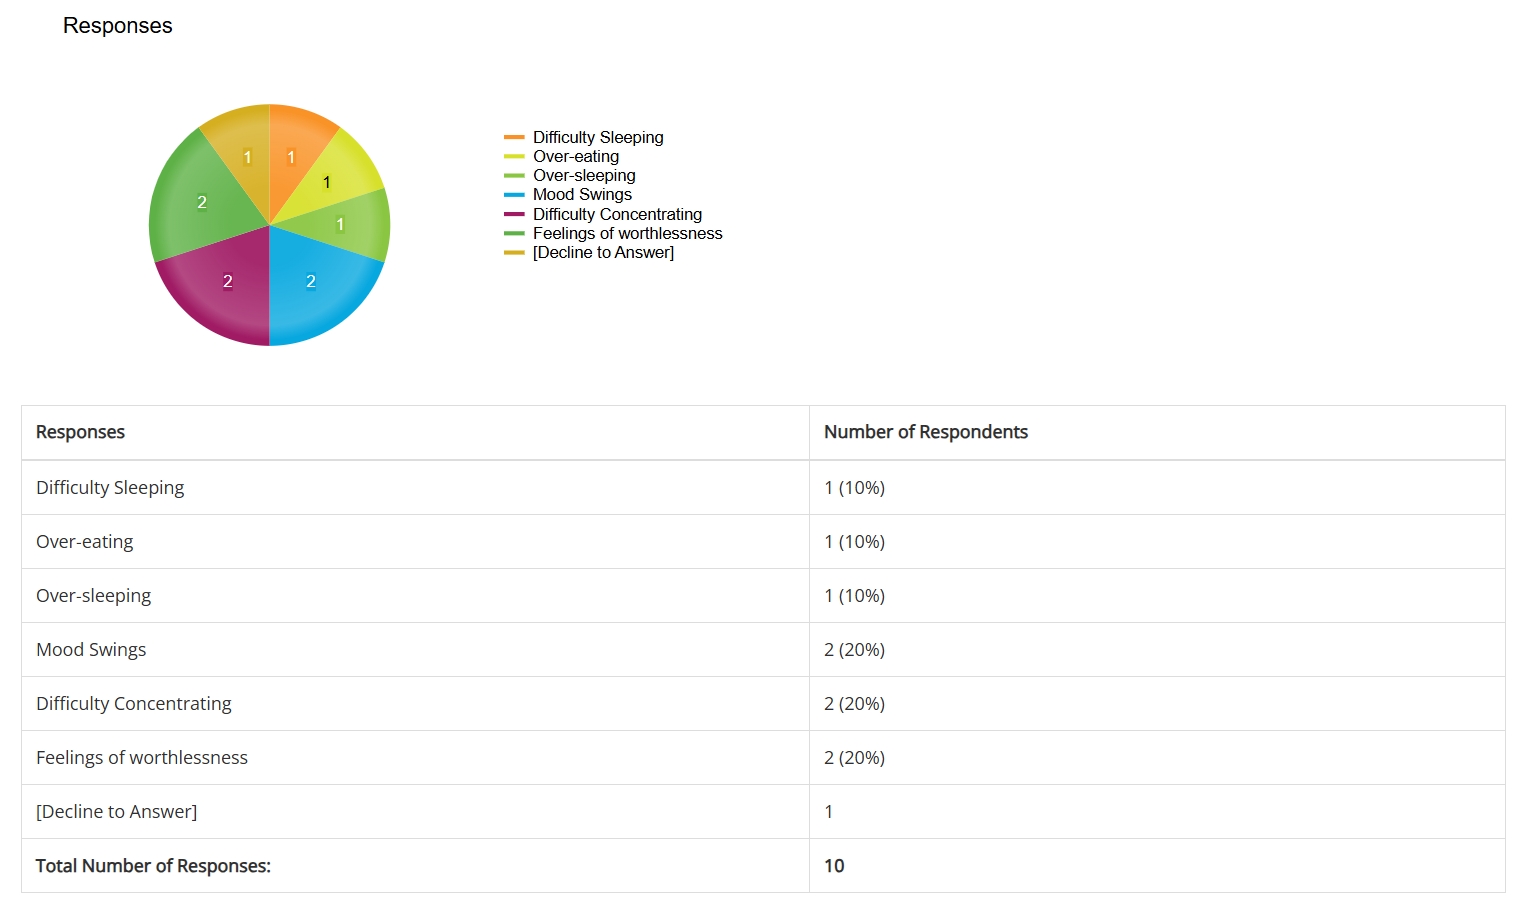
To summarize navigating Prescreen Response Summary, it’s two dropdown menus that specify section and question and generate both a pie chart (with labels and legend) and a complete breakdown of response counts and percentages in a table below.
Comparing Summary vs. Download Options
This might be a good time to offer some reassurance: If you’ve relied heavily (or at all!) on the old “Download Prescreen Responses” option for your studies, news about this new feature may concern you. Before you begin to feel the cold, icy grip of despair at the loss of a valuable tool, let us reassure you that we haven’t replaced anything. You can still find exactly the same page you used previously by selecting “Download Prescreen Responses” on the options page.
This raises an obvious question: What’s the difference?
In Brief:
Perhaps the easiest way to view the difference between Prescreen Response Summary and Download Prescreen Responses is as complementary. The former is an “on-screen” view of all multiple-choice responses across all study participants in a visual, easily interpreted display. It can be checked quickly, easily, and often (both during and after a study’s conclusion).
The latter (Download Prescreen Responses) option is akin to “raw data”. It’s formatted to make it easy to import into a basically any statistical or mathematical software as well as other tools used for data screening, cleaning, organizing, etc. It also includes responses to all prescreen items, including free text questions (which Prescreen Response Summary does not). You decide which tools, visuals, statistical methods, etc., are most appropriate for you and useful to you.
Put as briefly as possible, Prescreen Response Summary is an “on-screen” analytics tool, while Download Prescreen Responses provides you with raw data.
In More Detail:
Prescreen Response Summary and Download Participant Responses have, for obvious reasons, much in common. Both are ways for researchers to look at prescreen results from participants in their study. Both include response data from all participants who have signed up for a study (with the exception of those marked as no-shows). Both allow researchers to view prescreen responses “on-screen”.
Despite these and other similarities, there are important differences between the two tools. Understanding the differences can help you understand why we introduced Prescreen Response Summary (not that the feature needs this!) as well as how it can be used.
We introduced Download Prescreen Responses to give researchers a file in a format that they could download and then import to R or whatever statistical/computational software they preferred. This is still important, and is still available. This file includes all responses, not just those to multiple-choice question types (the type displayed in Prescreen Response Summary). However, Download Prescreen Responses is intended more to give you a feel for what the downloadable file will contain than to give you a feel for the actual data.
Unfortunately, this makes it difficult to get a feel for your sample characteristics (as determined by the response breakdowns) while the study is ongoing. You could still do this with Download Prescreen Responses, but you’d be downloading the entire response set at various points of an ongoing study (each time importing to R or some other statistical software). This can be particularly inconvenient if you’re mostly interested in the breakdown of three or four response items rather than the entire data file.
Finally, if there are a few prescreen items that are rather crucial to your study, Download Prescreen Responses doesn’t provide any way to focus on these. You can certainly extract only data related to these from the file, but wouldn’t it be nice to know something about participants’ responses before you download (and then import) the entire response set?
Prescreen Response View addresses all these limitations, and a whole lot more. You can easily track participant response distributions on the fly, get a feel for sample characteristics both during your studies and after they conclude, know which responses to target for additional analyses (and which methods to use), and even reveal patterns and other information that shed light on aspects of your work you may never have considered!
But Wait…There’s More!
We don’t want you to think that Prescreen Response Summary is “just” some better version of the “on-screen” version of Download Prescreen Responses. A few minutes of playing around with the dropdown menus—cycling through sections and questions and seeing the resulting charts and tables—will convince you that Prescreen Response Summary stands on its own far more quickly than we could here.
Of course, if you’ve never downloaded prescreen responses before, then the contrast won’t be as illuminating. You can’t very well compare Download Prescreen Responses with Prescreen Response Summary without some experience with the former.
Luckily, it doesn’t matter! It’s hard to spend any time with Prescreen Response Summary and not immediately start thinking about how this can inform your research!
Some applications we briefly touched on when comparing Download Prescreen Responses and Prescreen Response Summary. Perhaps certain responses in your studies will end up as categorical variables, or used in some complicated causal model (SEM, Path Analysis, Causal Network Analysis, etc.), or even used in the experimental design itself (in studies with various conditions, particularly those that may involve both within and between group analyses). In cases like these, where certain responses are of rather critical importance to your studies, being able to check on the counts and percentages for said responses is extremely useful.
On a simultaneously more practical and theoretical note, understanding sample characteristics is important. In any science where statistics are used (i.e., all of them, albeit not to the same extent or degree), understanding the make-up and characteristics of samples drawn (or recruited) is a foundational component of inference. In studies where “samples” are groups of people, we’d like to know a whole lot more whenever possible.
This gets into the more practical side. It could be as practical as noting that participants who selected X response tend to sign up very early or very late (which, actually, also has research implications!). Or whether or not participants in your studies are representative of the pool overall (which, depending upon the research design you are using and study questions you are asking, may be a good or a bad thing). This can now be checked by comparing Prescreen Response Summary in your studies with those of the pool using Prescreen Results:

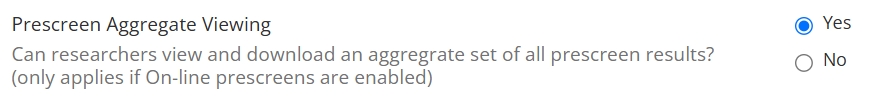
Prescreen Results allows researchers to see participant response breakdowns similar to Prescreen Response Summary, providing that Prescreen Results is enabled on your site. Administrators can enable or disable it using the Prescreen Aggregate Viewing option in System Settings:
However, Prescreen Results displays participant response counts and percentages for the participant pool, not for your study. It also doesn’t have the really nice graphs!
All of these uses don’t really depend upon the specifics of your prescreen questionnaire (beyond that you have an active prescreen that you use). If you factor in how you can include customize prescreen questions with this tool in mind, Prescreen Response Summary has nearly limitless possibilities!