Balanced Responses: Specify Participant Proportions for your Studies
Published March 21, 2025
Set Sign-up Percentages with Prescreen Response Distribution
Whether you are conducting a study that requires carefully determined proportions of particular racial/ethnic groups or would simply prefer a better gender balance in your studies more generally, the Prescreen Response Distribution (PRD) can make it happen! It allows researchers to determine participant sample proportions based on prescreen question’s responses, whether the question refers to average hours spent on social media or political party affiliation:
The Prescreen Response Distribution (PRD) allows researchers to pick any multiple-choice (select one) question from the prescreen, just as they would when selecting a question for eligibility.
However, instead of just selecting the qualifying response, the PRD allows you to set a desired percentage of participants for each response.
Beyond Prescreening: Advancing Study Designs with Sona
We recently introduced a powerful, new analytics tool to our prescreen feature. This was a major update, and we wouldn’t blame you for thinking it would be some time before you’d see any comparable updates to the Sona prescreen.
However, we’re introducing an even bigger release that won’t just change how you can use the prescreen feature but also change the way you conduct research: The Prescreen Response Distribution (PRD).
Post Preview: A Brief Look at What We’ll Cover
As you may have guessed, this post is all about the new Prescreen Response Distribution (PRD) feature. We’ll start by showing you how to set it up in an example study. We’ll then turn to how it works during the sign-up process. This will be broken into two parts: (1) the researcher’s perspective & (2) the participant’s. Both are needed to understand the sign-up process when using the PRD.
This will complete the basic introduction to using the PRD. From there, we’ll turn to some more advanced topics. The final section will be a few parting notes and recommendations that can be important to have in mind.
PRD Preamble
(NOTE: This feature is available for sites with Advanced subscription plans or higher.)
If you’ve run more than a dozen studies with participants, you’ve almost certainly dealt with imbalances in the sample recruited. Sometimes, this is little more than an inconvenience. It can be handled with a brief acknowledgement in the Methods subsection describing your participants when you write up your study for publication.
If you’re really unlucky, such as when the imbalance is with respect to study variable/factor or even a significant demographic variable, then it may mean another repeating study protocols with another recruitment iteration to address the imbalance. It may even mean starting over!
None of these are enjoyable situations for researchers to find themselves in. Quite the contrary. But even if there is a decent way to approximate a balanced sample with respect to this or that variable/factor/etc., it’s always with a great deal of work, time, effort, and (typically) mixed results. That’s what the new Prescreen Response Distribution tool changes. And it’s probably about time we showed you how.
First, we’ll need a multiple-choice (select one) prescreen question (technically, we first need a study and working prescreen, but we prepared those already for you).
First things First: Prescreen Eligibility Restrictions
To use the PRD, we start the same way we would if we were going to set prescreen eligibility restrictions (i.e., we visit the Study Information page where the Prescreen Restrictions panel is). There’s now an additional button, but we’re going to ask you to resist temptation (only briefly!) and refrain from clicking on it:
If the temptation is too great, it’s not the end of the world. However, if you haven’t already set prescreen restrictions, you’ll immediately get the following error message:
This is not as serious a warning as it may seem, because you’re still right where you need to be. If you scroll down, you’ll notice that what you see is what you would have seen had you clicked on the View/Modify Restrictions button instead (i.e., it looks like the prescreen restrictions page).
Before we can balance participant sign-ups based on prescreen responses, we need to make sure that only participants with those responses can sign up. That means setting prescreen restrictions. This is why it is a good idea take care of all study prescreen restrictions first, then moving on to setting the prescreen distribution. Even if your study only has the one restriction, and you intend to use it to set distributions, it’s still good to break this process up into two stages.
In our case, we can just go ahead and prepare to use the PRD using the current page.
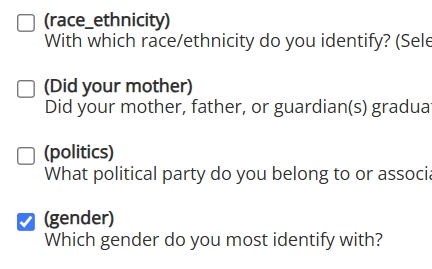
Proceeding just as we would to set prescreen restrictions, we first select the question we’ll use to set the response distribution:
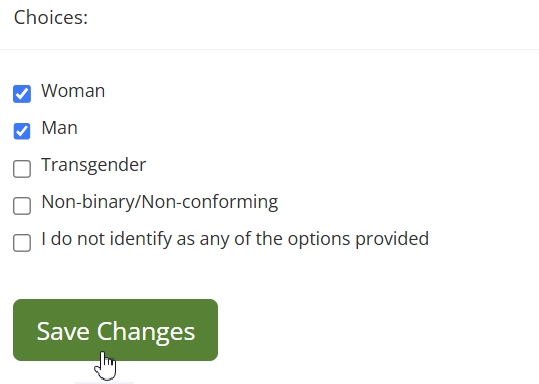
For our example study, we only want participants who answered the prescreen question on gender. Furthermore, we’re restricting eligibility to those who selected either Man or Woman for pedagogical reasons (i.e., simplicity):
Having selected the desired responses, we click the Save Changes button. This will return us to the Study Information page.
Setting your Targets
Now we can click on the new Set Prescreen Response Distribution button without fear of a warning message. Before we do, however, there’s an important difference between simply setting prescreen eligibility restrictions and the PRD we should note.
With the PRD, all responses you select must be from the same question, because you can only select one question at a time for a given study. The eligibility criteria can come from multiple prescreen questions, but only one can be used for the PRD.
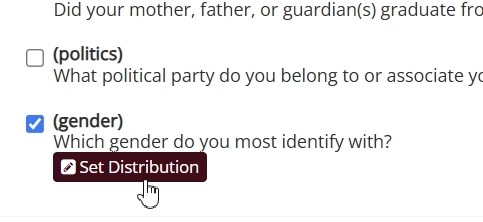
For our example study, we’ve only set prescreen restrictions on one question anyway, and if we scroll down, we can see that this is our only choice for our PRD question. It’s the only one with a button beneath:
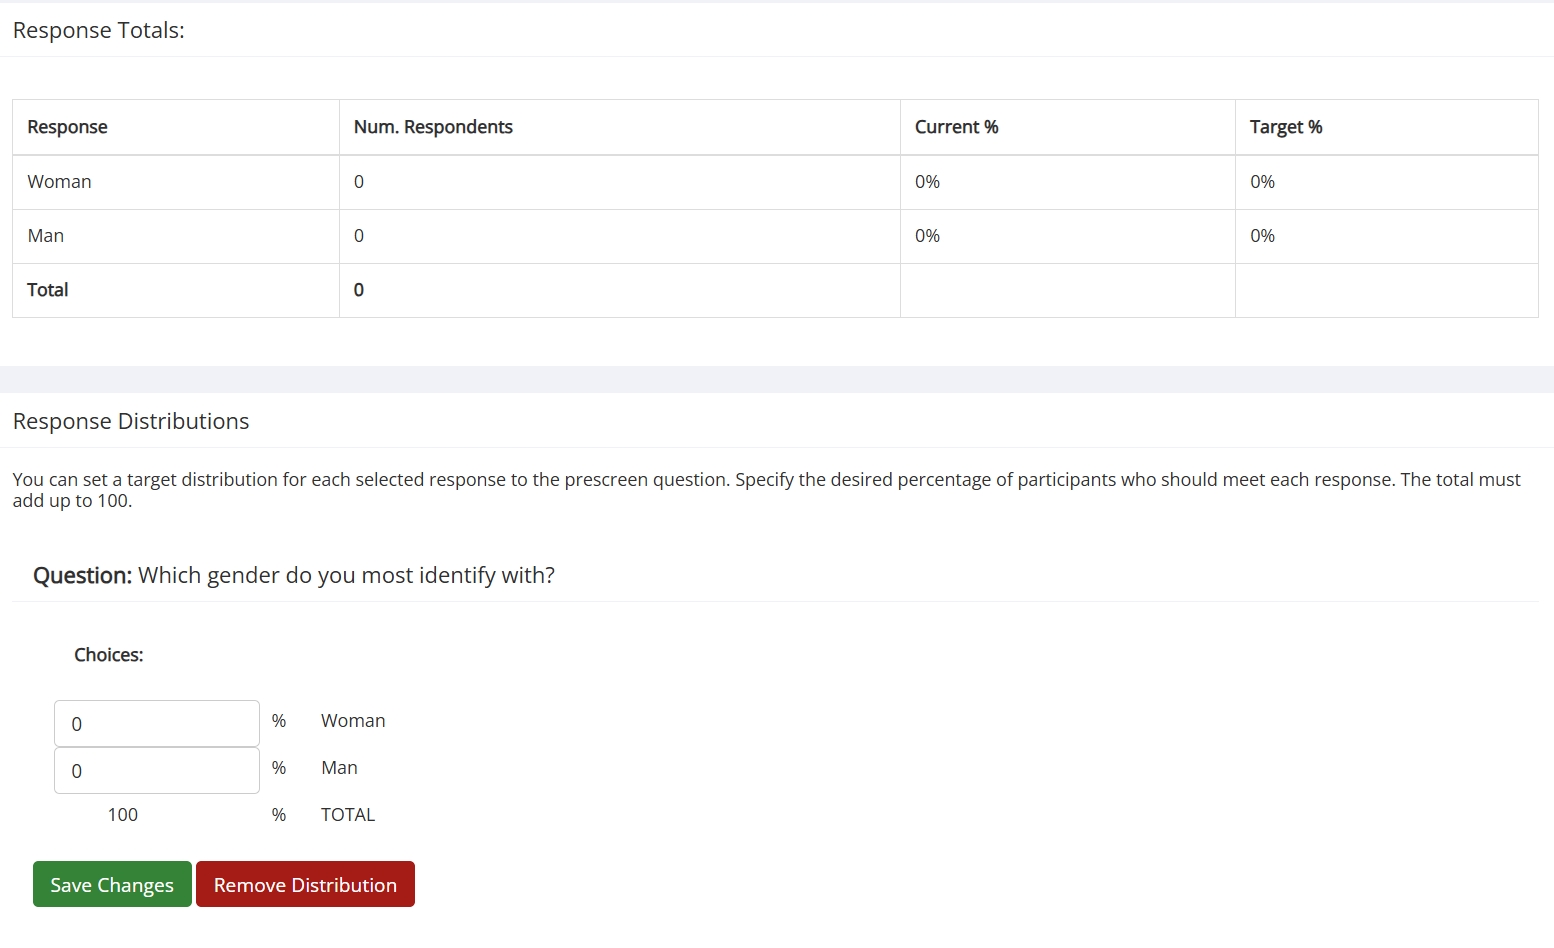
This will bring us to the PRD main page:
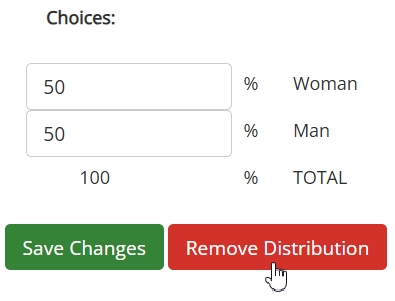
For now, ignore we’ll ignore the table (what it is and how it works comes later). We want to set our target distributions. Setting the target distributions is as simple as picking the percentage of participants you want for each response, then making sure this adds up to 100%. For simplicity, we’ll set a target of 50% “Woman” responses and 50% “Man” responses, i.e., a 50/50 ratio:
Although we’re doing it in this example, you don’t need to response percentages to be equal. What matters most is that the total to adds up to 100%.
Once we’ve entered in the desired percentage values (which for our example is 50% for both responses), we only need to click the save button and that’s it! We’ve finished setting up our study with the PRD.
We’re not, however, finished using the PRD (remember that table?).
Watching the PRD in Action
We’ve seen how to set target distributions using a percentage for each selected response. Technically, the researcher’s work is basically done at this point. But just because you select a certain percentage does not mean that participants will be automatically transported to the lab in specified proportions (we’re still working on Sona’s teleportation capable technologies equipped with retrocausual time-reversed loops and backwards-in-time-propagating informed consent, among other trivial obstacles). Participants pick the studies they want to participate in, and do so when they choose to.
How, then, does the PRD work? In many ways, it’s similar to the existing method researchers use to restrict study eligibility. We can better grasp the differences by comparing standard prescreen restrictions with the PRD using our example study.
How would our example study have worked if we had stopped after setting the prescreen restrictions? Same question, same two responses (“Man” or “Woman”), but no PRD settings. We know that 100% of participants will be those who selected one of the two allowed responses. Beyond that, though, the system doesn’t enforce any constraints. As long as timeslots aren’t full and the sign-up date hasn’t passed, eligible participants can sign up. This part is familiar, as so far it is how prescreen eligibility restrictions work.
The PRD changes things by offering another scenario: An eligible participant signs up, the system checks the target distributions, and then determines that participant’s “current eligibility” based on the current sign-up proportions.
In our example, then, if the study currently has a 50/50 proportion of “Men” and “Women” respondents, then a participant with either of these can sign-up. However, if there are too many sign-ups who selected “Woman” or too many who selected “Man”, then the system will inform the participant that the study is temporarily unavailable (we’ll see exactly what this looks like soon).
(Re-)Introducing…the Table
We ended the PRD set-up section with an aside about the table on the PRD page. If you recall, although we mentioned the table in that section, we put off discussing it until later. Well, now it’s later.
The table will serve two purposes here. On the one hand, it will make this discussion less abstract and give us some helpful visuals. On the other hand, the table is ultimately part of using the PRD. Here, you will learn how to use it in practice.
Let’s look at the table from our example study, picking up where we left off (before any sign-ups):
Interpreting the table is too simple for us to spend much time on it. More important for our purposes will be how it should look, and how this should change over time. Looking at the image above, it’s easy to see that the table looks as we’d expect. There are no sign-ups, so the only non-zero values should be (and are!) those in the Target % column.
As time passes, and participants start signing up, these values will naturally change. This is perhaps the primary use of the table in practice: Checking on the current status of the sign-up process. And, in the hypothetical world of our example study, it’s time we do just that:
A “Woman” participant signed up, and we can see the expected 1’s in the expected places in the Num. Respondents column. Of greater interest is our Current % column, which has changed to reflect the fact that 100% of participants selected “Woman”.
We wait a bit longer, checking the table occasionally, until another participant signs up:
Another sign-up, this one a “Man”, brings us back to our desired 50/50 distribution. So far, we’ve been lucky, but participants are unlikely to continue this alternating sign-up trend. In fact, the trend we see doesn’t necessarily reflect all sign-up attempts. But to explain how the system handles this situation, we need to look through a participant’s eyes.
Temporarily Unavailable: What Participants See
We left off our example study in a perfectly balanced 50/50 state. It doesn’t really matter whether a “Man” or “Woman” participant signs up next, because the system will accept either, and the table will reflect that. It turns out that another “Woman” participant signed up:
So far, nothing surprising has happened, at least as far as we can tell looking at the sign-up status from a researcher’s perspective. Now, though, things will get more interesting. We’ll get to see the part of the sign-up process that doesn’t make it to the table. To do this, we have to employ a volunteer participant to see what the table won’t show.
Emmy Noether has kindly agreed to share her screen with us so that we can experience the sign-up process through her eyes. After logging in, the first thing we want to check is whether she can see the study:
Emmy is eligible and she can view the study. so far, so good. She clicks on the study and scrolls down to View Timeslots for This Study, but instead she sees this:
This is how the system enforces the response percentage targets you set. Eligible participants will always be able to view the study, but when the study diverges too far from the target values researchers set, the system will temporarily halt sign-ups from overrepresented participants. Once enough participants with underrepresented responses sign up, those who were temporarily prevented from completing the sign-up process will be able to do so.
Beyond Balance: Improving Study Designs with the PRD
We’ve covered how to set up the PRD for a study and how it works once set up, both from the researcher’s and participant’s perspectives. On the other hand, we’ve hardly touched on how to use the PRD. Of course, those who will be using this are familiar with designing studies and conducting research. We don’t have any intention of explaining research methodologies and whatnot to experts, so we’re not going to turn this into a mini-course or lecture notes or anything of that sort.
We did, though, work with a single example in the simplest way possible. It’s not a bad idea, then, to counter this simplified presentation by touching on some more advanced topics.
Proportionally Representative Recruitment
Balanced studies, in the sense of approximately equal response groups (e.g., equal “Men” and “Women”) aren’t always preferable. Sometimes, researchers want more participants from some response groups than from others. Often, this has to do with the study design and methods employed. In those cases, it’s straightforward to simply change the Target % values accordingly.
Sometimes, however, the goal is to have participant samples approximate the proportions found in the participant pool. These can be to approximate proportions in a larger population, but there are quite practical reasons that can hold regardless of whether this is the case. It may be that researchers would, in an ideal world (one that researchers never encounter), choose to set the same Target % values across response selections for a particular study. In the actual world, this may not be the wisest choice.
To see why, imagine that these researchers are looking at political party affiliation as an independent variable. In all likelihood, they’d prefer to have a sample of e.g., 50% Republicans and 50% Democrats. This is all well and good, but what if most participants are Democrats? And what if of those remaining, many belong to a non-Republican party (e.g., Independent), while only a minority are Republicans? A 50/50 ratio of Democrats and Republicans may still yield the best results (if the minority response group is still sufficiently large enough for the study purposes), but it may not.
Put simply, if we have two response groups A and B, and they are disproportionately represented in the overall pool, then sampling equal proportions may be prohibitive. If 99% of participants selected response A, and 1% response B, there may not be enough response B participants to meet a 50/50 distribution setting.
Quite apart from practical considerations, there also times when the goal is to have sample proportions match or approximate those found in some larger population. This may be the case when it comes to e.g., race/ethnicity.
The PRD by itself can’t address these methodological issues. Fortunately, the prescreen already allows researchers to obtain participant pool totals (sometimes via the administrator) to any given question’s responses. Not only that, but the prescreen analytics tool, View Response Summary, can help researchers track response breakdowns to dynamically adjust the PRD values if necessary.
It’s as easy to set unequal Target % values for a study as it is to set equal ones. If the reason for different percentages relates to the study design or similar factors known in advance, then researchers can simply plug in the desired values. If researchers wish to account for the proportions of responses as they are actually realized among participants, this is almost as easy. It involves an additional step (obtaining the prescreen response totals for the pool), so that researchers can determine which percentages are ideal, but is still easily accomplished.
Quod ergo Sona conuixit…Two Studies in One
The following scenario is a fairly common one: A researcher wants to restrict a study to two or more participant subgroups based on prescreen responses to form different groups (e.g., “morning”/”night” people, conservative/liberal, pro-X vs. anti-X, exhibiting Y behaviors vs. Z behaviors, etc.). The study protocols are the same for all participants (regardless of group), and the goal is to compare e.g., a treatment group vs. a control group, or group A vs. group B, etc.
A common way to implement such studies in Sona is the following. Suppose the researcher has two participant groups, Group A and Group B (each identified using the prescreen). The researcher needs to recruit sufficiently many participants to make valid comparisons. So they set up two identical studies—Study 1 & Study 2. They then set an eligibility restriction on Study 1 so that only Group A participants can sign up for it. They then do the same for Study 2 and Group B.
This is a good workaround that plenty of researchers have successfully implemented. But it’s no longer the best method. With the PRD, the researcher can create a single study that better ensures both Group A and Group B will be suitably represented.
Dynamical Distributions: Adjustments on the Fly
Just because you start with certain response distributions doesn’t mean they are fixed until your study ends. You can re-adjust the percentages and then save, or even remove the percentage settings entirely using the Remove Distributions button:
This freedom can improve recruitment results and allows greater researchers greater flexibility when it comes to designing and planning studies. It also, however, opens the door for mistakes. The PRD isn’t intended to be a constantly adjusted setting. It allows for adjustments because those can be important or even needed. But if you aren’t careful, you can accidentally prevent participants from signing up by choosing Target % values that are difficult or even impossible to meet partway into your study.
If you are thinking about dynamic adjustments, it’s also good to consider the Remove Distributions button. If you needed certain minimal numbers more than you did a careful balance, then consider simply removing the distributions. It’s simpler and less likely to have unintended consequences than tweaking the percentages for your response choices.
Parting Words of Wisdom
We’ve covered the basic applications of the PRD, and we’ve touched on a few more advanced applications and considerations as well. This should provide you with more than enough information to use the PRD in your research, allowing you to make it easier to implement more sophisticated study protocols with better results (and not only with respect to recruitment!). That leaves us with only a few closing notes and helpful hints.
Manual Mix-Ups
Although it doesn’t come up very often, the effects of manual sign-ups are still something to keep in mind. The PRD doesn’t prevent manually adding a participant to a timeslot. Just as with prescreen restrictions in general, however, if you attempt to add a participant, and this addition would violate the constraints imposed by the PRD, you will get a warning:
This message is specific to the PRD settings. If you attempt to manually sign-up a participant who doesn’t meet the eligibility criteria, the system message will warn you about eligibility, not the limits set by the PRD.
Informing Participants
We’ve already seen what a participant will see if they are eligible for a study but the PRD won’t allow them to sign up at that time. It’s a fairly basic message, after all:
“You are eligible to sign up for this study, but timeslots are temporarily unavailable. Please check back later.”
We kept it basic by design. This doesn’t necessarily mean it’s the optimal way to inform participants about the sign-up process when using the PRD. Often, participants neither need to know nor should know that there are restrictions for a particular study, let alone percentage values for the selected responses.
That said, researchers may want to tell participants (e.g., in the study details) something about what to expect when signing up. For example, researchers may want participants to know that sign-up slots will be more variable for X study, but not to worry if they see a message indicating the study is temporarily unavailable. Alternatively, researchers may want to tell participants that if they see this message, they should check back in the next day or every few days.
There are plenty of other messages that may be better suited for a particular study, and even the two we provided aren’t mutually exclusive. The point we want to make here isn’t what researchers should or shouldn’t tell participants when using the PRD. it’s to be aware of what participants will see, and decide whether or not additional information may help ensure participants do, in fact “check back later.”
And these few precepts in thy memory…
You now know the basics, some more advanced methods, and some additional tips and notes to be aware of when using the PRD. The only thing left to do is, now that you’ve seen how to use it, is to do so! We look forward to hearing about (and reading about) your successes!
